Welcome to the Seedlot Explorer for Extrazonal Deployment - SEED

SEED provides a suite of tools designed to help land managers quickly and efficiently identify areas that are at-risk of local maladaption and to identify alternative seed sources that can provide well-adapted seed for those areas. SEED provides the means for land managers to identify adaptive seed deployments for any planting target in the Pacific Northwest, California, or the Northern Rockies. SEED is primarily designed to support reforestation and restoration efforts on National Forest System lands, but some of its tools (Mismatch Viewer and SST Viewer) can be used across all land ownerships. The tool descriptions below summarize the full SEED toolset and give a few examples of typical ways the tools can be used. Please note that some features of SEED are limited to certain regions. For instance, complete seed inventories are not available for California or the Northern Rockies at this time. As such, seed inventory functionality is limited to National Forests in the Pacific Northwest. If you run into any issues or bugs while using any of the tools within SEED, please notify the developer of SEED - Bryan Reatini at Bryan.Reatini@usda.gov so they can be promptly resolved.

Tool Descriptions

Mismatch Viewer: Assess risk of local maladaptation at the seed/breeding zone level

The Mismatch Viewer tool (see tab at the top of the page) is designed to help land managers assess risk of local maladaptation due to climate mismatch between the historic conditions local populations are adapted to and the present-day climate conditions they are experiencing. This tool allows the user to visualize the degree of climate mismatch for several different sets of seed/breeding zones in the Western US. A typical application of this tool would be to assess the degree of climate mismatch in your local area of interest, and then use those data to determine which seed/breeding zones should be targeted for adaptive seed deployment.

SST Viewer: Explore Seedlot Selection Tool runs for any seed/breeding zone in the Western US

The SST Viewer tool (see tab at the top of the page) allows land managers to quickly and efficiently view and download Seedlot Selection Tool runs for any seed/breeding zone in the Western US. SST runs can be viewed in two formats. 'Single Projection' mode generates a SST raster for a single climate condition following the same general methodology as the SST web-application (i.e. using the zone-center method for defining the Transfer Limit and using the default climate variables of Mean Coldest Month Temperature and Summer Heat:Moisture Index). 'Stacked' mode displays a composite raster of each individual SST raster from present through late-century to enable the identification of areas where a given seed source will be well-adapted to under present-day conditions, and how long that seed source is predicted to remain well-adapted to those areas. A typical application of this tool would be to find the best available planting sites for a given seed source.

Deployment Builder: Build an adaptive seed deployment plan for National Forest Service lands

The Deployment Builder tool provides a sandbox-like environment where NFS land managers can interactively design an adaptive seed deployment plan for a wide range of applications. For example, the tool can be used to find the best available adaptive seed sources for any deployment target within a given National Forest (e.g. a specific deployment zone or a user-uploaded fire perimeter). The tool can also be used to identify which source zones together can cover the entirety of a deployment target (e.g. fitting different deployment areas together like puzzle to cover the whole target). Due to being integrated with the regional seed inventory (at least for the Pacific Northwest), the Deployment Builder tool also allows land managers to identify adaptive sources that have seed available on inventory, or to identify which adaptive sources require additional collections due to low/absent seed balance.
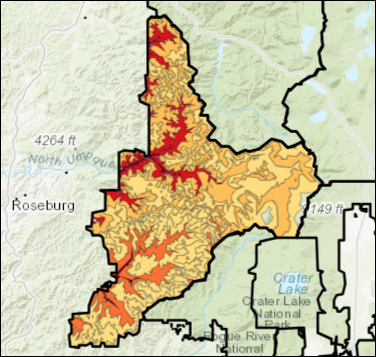
Tool Description: The interactive map below displays the degree of climate mismatch from historic climate conditions (1961-1990) to present-day climate conditions (1991-2020) for the selected set of seed/breeding zones. Climate mismatch is quantified as the percentage of the zone that, under present-day conditions, remains within the historic range of climate conditions observed within the zone (i.e. the percentage of the zone within its transfer limit). Darker shades of red denote zones with greater degrees of climate mismatch, wheras lighter shades denote more climatically stable zones. In general, zones that are more mismatched are at greater risk of local seed suffering from reduced performance (e.g. long-term growth and survival) due to being maladapted to the present-day conditions within the zone. These are high priority zones to target for adaptive seed deployment. The results can be saved as a shapefile using the button below the plot.
Loading...
Tool Description: The interactive map below displays zone-based Seedlot Selection Tool (SST) runs for any seed/breeding zone in the Pacific Northwest, California, or the Northern Rockies. SST runs are generated using the climate center of the selected zone and the historic range of variation in the zone to define the Transfer Limit. The two variables used to calculate match scores are Mean Coldest Month Temperature (associated with cold hardiness) and Summer Heat: Moisture index (associated with drought tolerance). The 'Single Projection' option displays an SST raster for a single climate projection using the same algorithm as the SST web app. The result is a raster with climate match scored from 0-100, just like in the SST web app. The 'Stacked' option overlays the single projection SST rasters for Present, Early, Mid, and Late Century (SSP3-7) to create a nested composite raster. In this raster, climate matched acreage is scored 1-4 with 1 being matched to just present-day climate, 2 for acreage matched from present through early century (Present-2040), 3 for present through mid century (Present-2070), and 4 for present through late century (Present-2100). Thus, acreage with a score of 4 (Present-2100) represents areas where seed from the selected source zone will likely remain well-adapted from present-day conditions (i.e. based on empirical data) through the end of the century (based on climate projections). This is the best case scenario. However, it is important to note that all areas colored in this plot (i.e. all areas with scores 1-4) are AT LEAST matched under present-day climate conditions. Both single projection and stacked SST runs can be saved as a tiff using the download button below the map.
Loading...
Tool Description: The two tabs below allow you to quickly and efficiently identify well-adapted seed sources for any deployment target on NFS lands in the Pacific Northwest, California, and the Northern Rockies. Specifically, the left-hand navigation panel allows you to select the species you're hoping to find seed for, where you're hoping to deploy seed (i.e. the deployment target), and your criteria for identifying seed sources (e.g. which types of source zones, and both climate and geographic transfer distances). The 'Matched Deployments' tab shows a table of all potential seed sources that are a match for the selected deployment target, ranked by how good of a match they are. It also shows the balance of seed available in the regional seed inventory for each of those source zones. In this table, you can select rows to save to a csv (using the button below the table) or to visualize results for. The 'Deployment Viewer' tab is then used to visualize the results for the source zones selected in the table. Specifically, an interactive plot displays the matched acreage for each selected deployment (i.e. source zone) within the deployment target, a summary plot of the balance of seed available for each selected deployment, and a plot of the long-term projection of climate match for each selected deployment within the deployment target. These results can be saved as both a shapefile or html report using the download buttons below the plots.
Loading...
Loading...
Loading...